Trading-Blog
Systematisch, tiefgehend, umsetzbar. Kuratiert für Anfänger.
63 Artikel in #technical-analysis werden angezeigt
#technical-analysis
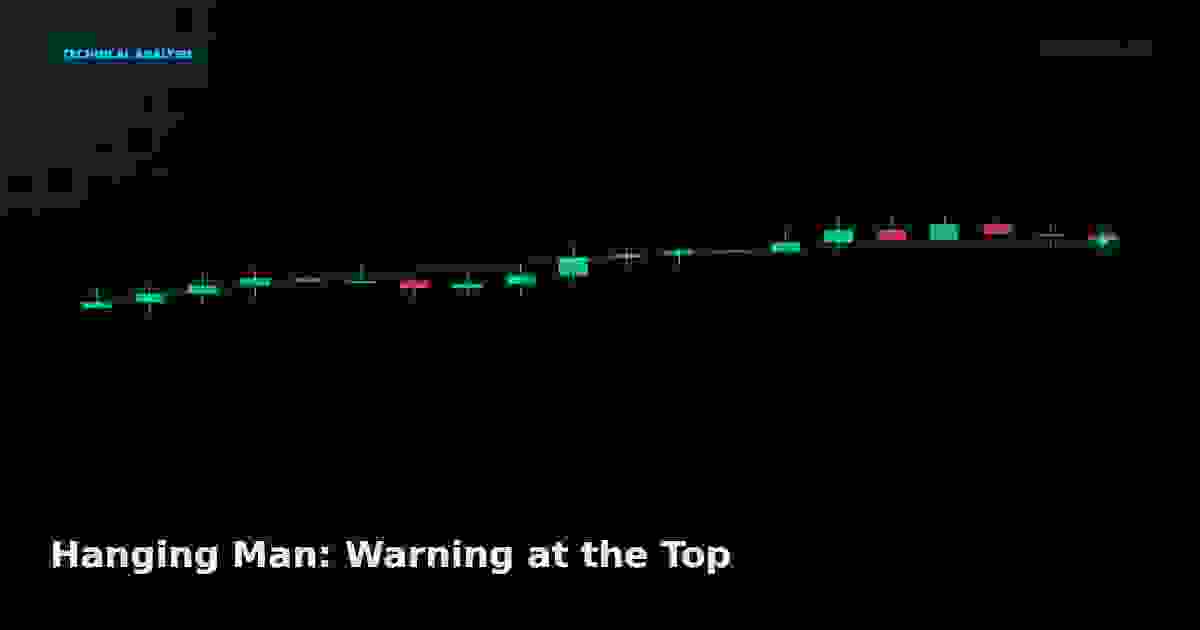
Hanging Man: Warning at the Top
The hanging man is a bearish reversal candlestick that forms after an uptrend and warns of a potential top.
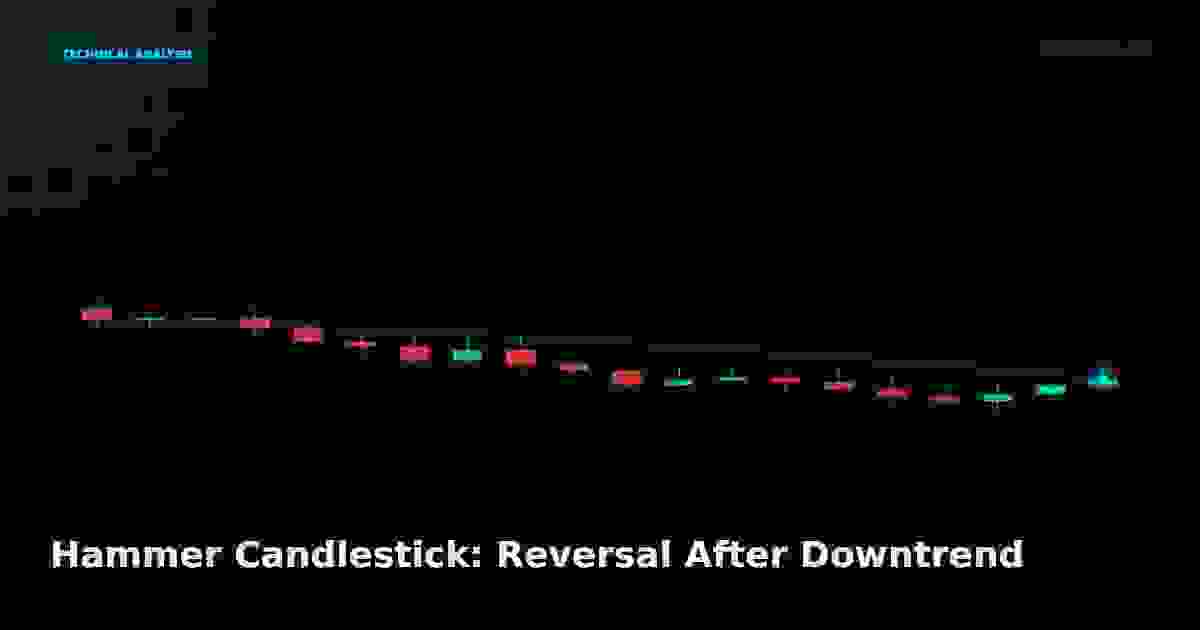
Hammer Candlestick: Reversal After Downtrend
The hammer candlestick forms after a downtrend and signals a potential bullish reversal.
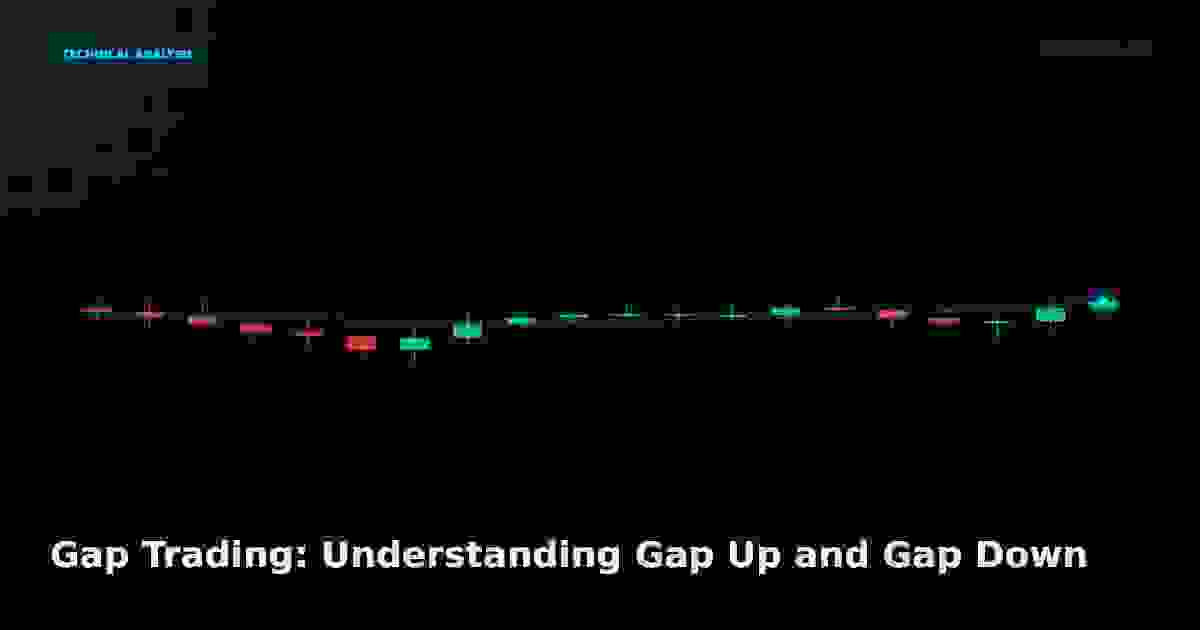
Gap Trading: Understanding Gap Up and Gap Down
Gap trading focuses on price gaps between trading sessions and how traders can profit from filling or extending them.
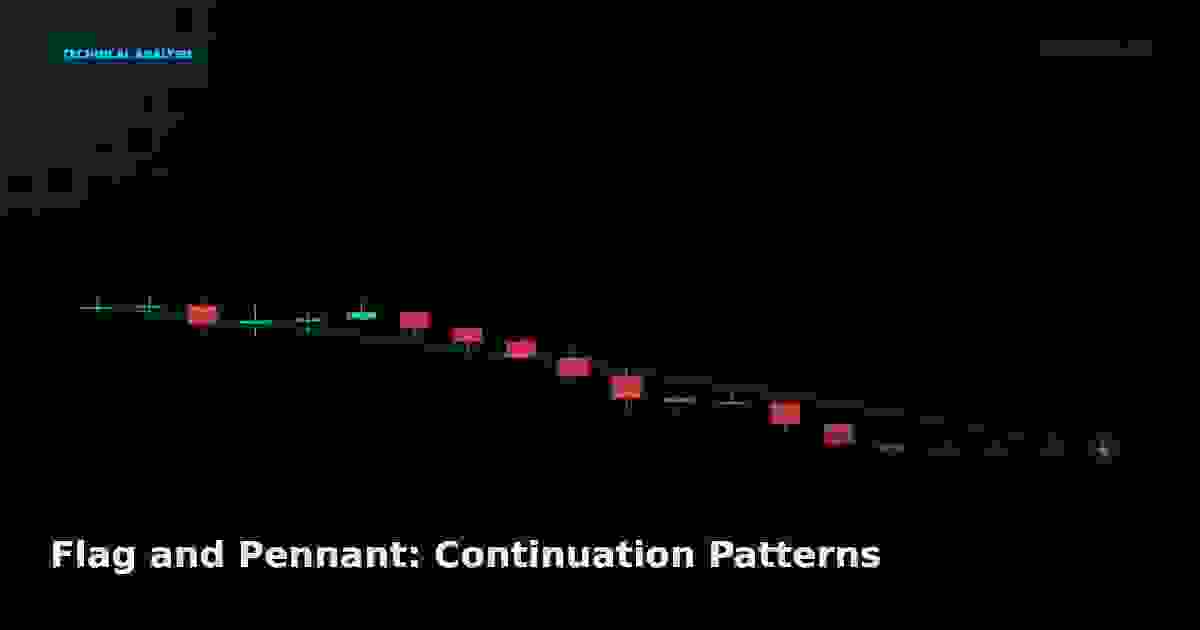
Flag and Pennant: Continuation Patterns
Flag and pennant patterns are short-term continuation formations that form after a strong directional move.
Fake Breakouts (Fakeouts): How to Avoid the Trap
Fake breakouts occur when price breaks beyond a level but quickly reverses, trapping traders on the wrong side.
Evening Star Pattern: Bearish Reversal
The evening star is a three-candle bearish reversal pattern that forms at the top of an uptrend.
Double Top Pattern: Bearish Reversal Signal
The double top is a bearish reversal chart pattern that forms after an uptrend and signals a potential trend change.
Double Bottom Pattern: Bullish Reversal Signal
The double bottom is a bullish reversal chart pattern that forms after a downtrend and signals a potential trend change.
Doji Candlestick: Indecision in the Markets
The doji candlestick signals market indecision when buyers and sellers reach equilibrium.
Dark Cloud Cover: Bearish Reversal Signal
The dark cloud cover is a two-candle bearish reversal formation that appears at the top of an uptrend.
Cup and Handle Pattern: Bullish Continuation
The cup and handle is a bullish continuation pattern that resembles a teacup and signals the resumption of an uptrend.
Trading Channels: Ascending, Descending, and Horizontal
Trading channels are parallel trendlines that contain price action and provide a framework for trading trends and ranges.