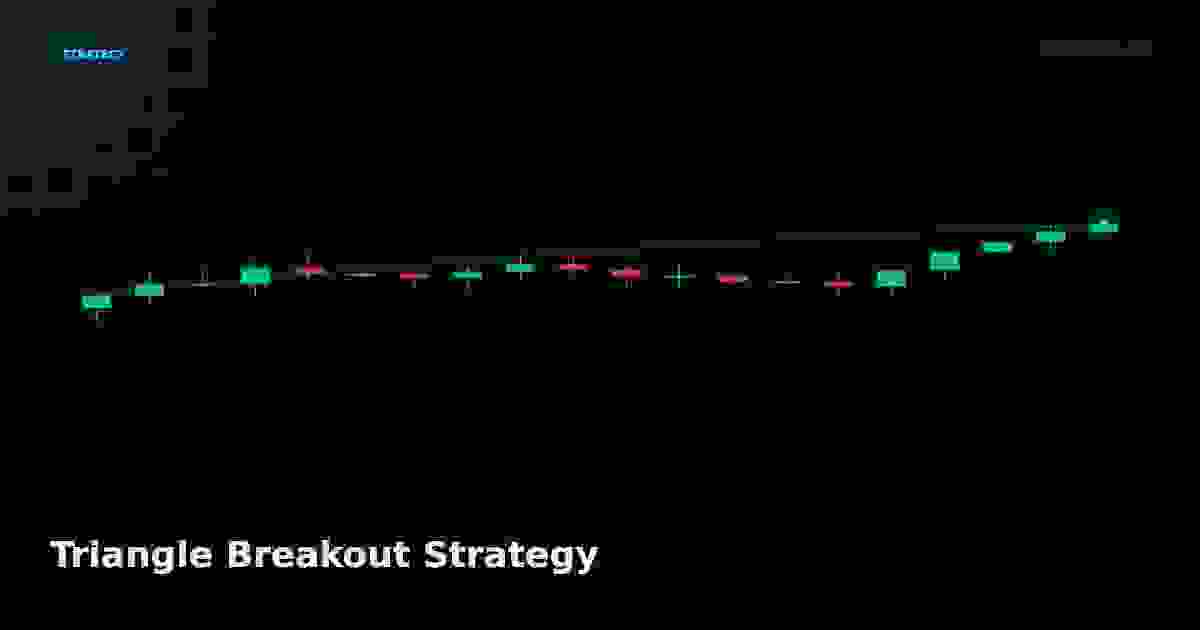
Triangle Breakout Strategy
A triangle breakout strategy that trades the escape from a contracting consolidation, capturing the directional move that follows.
Overview
Triangles form when volatility contracts and price coils between converging trendlines. A breakout usually resolves in the direction of the prior trend. This strategy trades the moment price escapes the triangle — symmetric, ascending, or descending — with volume confirmation to filter false moves.
Setup
- Instruments: forex majors, stocks, index ETFs, crypto
- Timeframe: 4H or daily
- Indicators: two converging trendlines, ATR(14), volume, the prior trend
- Market regime: a consolidation inside an existing trend
A valid triangle needs at least two touches on each trendline. The apex — where the lines meet — should be ahead, not behind.
Entry rules
- Identify the triangle type: symmetric (both lines slope), ascending (flat top, rising bottom), descending (flat bottom, falling top)
- Wait for a candle to close beyond a trendline in the direction of the prior trend
- Volume on the breakout bar should be at least 1.5× the 20-bar average
- Enter on the close, or on the retest of the broken trendline for a safer entry
Stop loss
- Stop just inside the triangle, beyond the breakout candle
- Alternative: 1 × ATR(14) beyond the breakout candle's extreme
- Exit if price closes back inside the triangle within two bars — the break was false
Use the stop loss calculator to set the level.
Take profit
- Measure the triangle: project the widest part of the triangle (the base) from the breakout point
- Take partial profits at the measured move target
- Trail the remainder with a 20 EMA or exit on a reversal candle
Confirm the target with the risk-reward calculator.
Risk management
- Risk 1% of account equity per breakout
- Position size = risk amount ÷ (entry − stop). Verify with the position size calculator
- Maximum two triangle breakouts open on correlated instruments
- Reduce size when the breakout occurs very close to the apex — late breakouts are weaker
When it fails
Triangles fail when the breakout lacks volume or happens in the wrong direction (against the prior trend). Symmetric triangles in particular can break either way, so confirm direction before committing. A false break that returns inside the triangle often signals the opposite move — respect the stop rather than flipping position.
Backtest Results
Hypothetical backtest — past performance does not guarantee future results. These numbers are illustrative, not a promise. Always forward-test on demo before live trading.
Test parameters:
- Instrument: BTC/USD and ETH/USD (crypto majors)
- Timeframe: 4H
- Period: 2020-01-01 to 2025-12-31 (5 years)
- Risk per trade: 1% of account
- Commission/slippage: included
| Metric | Value |
|---|---|
| Total trades | 180 |
| Win rate | 39% |
| Average win | +3.2R |
| Average loss | -1.0R |
| Expectancy | +0.64R |
| Max drawdown | 26% |
| Annualized return | 22% |
| Profit factor | 2.0 |
| Best trade | +9.1R |
| Worst trade | -1.4R |
| Avg trades/month | 3 |
What the numbers mean
A low win rate with large average wins — triangle breakouts fail often, but the ones that resolve in the prior trend's direction run far. The 26% drawdown is the price of waiting through many false breaks in a low-frequency pattern; the positive expectancy depends entirely on letting the few winners reach their measured-move target.
Weaknesses to watch
- Symmetric triangles break either way, so trading them without a prior-trend confirmation halves the win rate and turns expectancy negative
- Low-volume breakouts fail at a high rate; skipping the 1.5× volume filter is the single biggest leak
- Breakouts very close to the apex are weak and choppy, so late breakouts underperform even when direction is correct
How to use this data
Use these numbers as a baseline expectation. If your live results are significantly worse after 50+ trades, something is off — either the market regime changed, or your execution differs from the backtest. Do NOT scale position size based on backtest optimism.
My Notes
Log in to save notes on this article and share them with the community.
Strategy is for educational purposes only. Not financial advice.
Related
Building a Trading Strategy
Turn scattered setups into a real strategy. Entries, exits, stops, backtesting, and iteration.
blogCurrency Pair Classification: Majors, Minors, and Exotics
Compare major, minor, and exotic currency pairs by liquidity, spread, and volatility to pick instruments that match your strategy and risk.
blogReading the Economic Calendar: NFP, CPI, Rate Decisions, and PMI
Read the economic calendar for NFP, CPI, central bank decisions, and PMI so volatility events become planned trades, not accidents.
Related Glossary Terms
Trend
technical-analysisThe overall direction price is moving over a period. Up trends make higher highs and higher lows; down trends make lower highs and lower lows.
Breakout
technical-analysisWhen price moves clearly beyond a support or resistance level, often with rising volume. It hints that a new move in the breakout direction has started.
Pullback
technical-analysisA short move against the trend after a breakout or impulse, before the trend resumes. It offers a lower-risk entry than chasing the initial move.
Read next
Dual Moving Average Crossover Strategy (Beginner Edition)
One of the most classic trend-following strategies. Simple rules, easy to execute, ideal for beginners trading stocks or crypto on daily timeframes.
Read more →