トレーディングブログ
体系的、深掘り、実践的。初心者向けに厳選。
#advanced-charting の記事を16件表示
#advanced-charting
Renko vs Kagi vs Line Break: Choosing the Right Alternative Chart
Renko, Kagi, and Three-Line-Break each filter noise differently, and matching the chart type to market regime, holding period, and instrument volatility produces measurably better trend reads than defaulting to one.
Price Action and Volume Composite Chart Construction
A composite chart that overlays candlesticks, a volume sub-panel with a 30-bar average, a volume profile, and a delta histogram turns three independent reads into one picture for entry and exit decisions.
Point and Figure: Horizontal Count Target Measurement
Point and Figure charts produce objective price targets via horizontal and vertical counts, and the horizontal count method gives measured-move projections that outperform candlestick targets in trending regimes.
Multi-Timeframe Screen Layout: A Three-Grid Design
A three-grid screen layout with fixed timeframe ratios, indicator consistency, and a top-down decision flow turns multi-timeframe analysis from a tab-switching chore into a single-glance read.
Heikin Ashi as a Trend Filter: Entry and Exit Rules
Heikin Ashi candles smooth price into a trend picture, and a four-rule filter using candle body, wick, and colour sequence converts them into objective entry and exit signals with defined invalidation.
Custom Indicator Scripting: Pine and ThinkScript Starter Patterns
Building custom indicators in Pine Script and ThinkScript follows repeatable patterns; five starter templates for alerts, multi-timeframe reads, confluence scoring, and visual overlays get you from blank editor to working tool.
Chart Annotation and Trading Plan Template Workflow
A disciplined chart annotation workflow with a fixed six-block on-chart plan template turns each setup into a pre-committed decision recorded where the trade happens, removing improvisation under pressure.
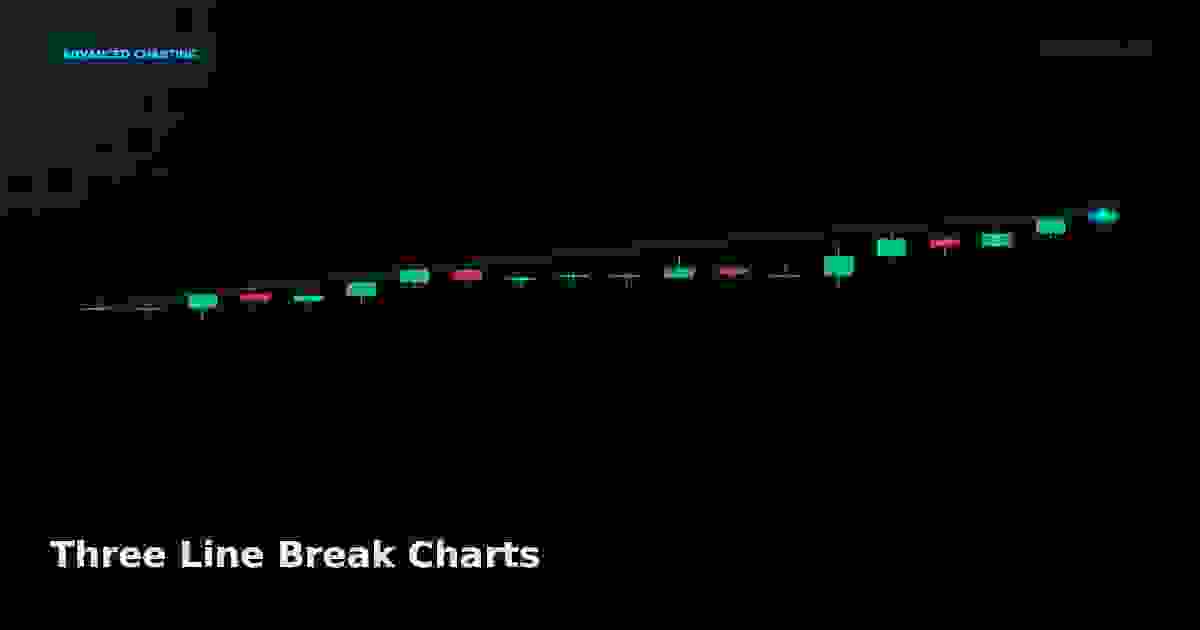
Three Line Break Charts
Three Line Break charts print reversals only when price exceeds the prior three lines, filtering out minor swings and isolating trend continuation.
Renko Charts: Filtering Market Noise
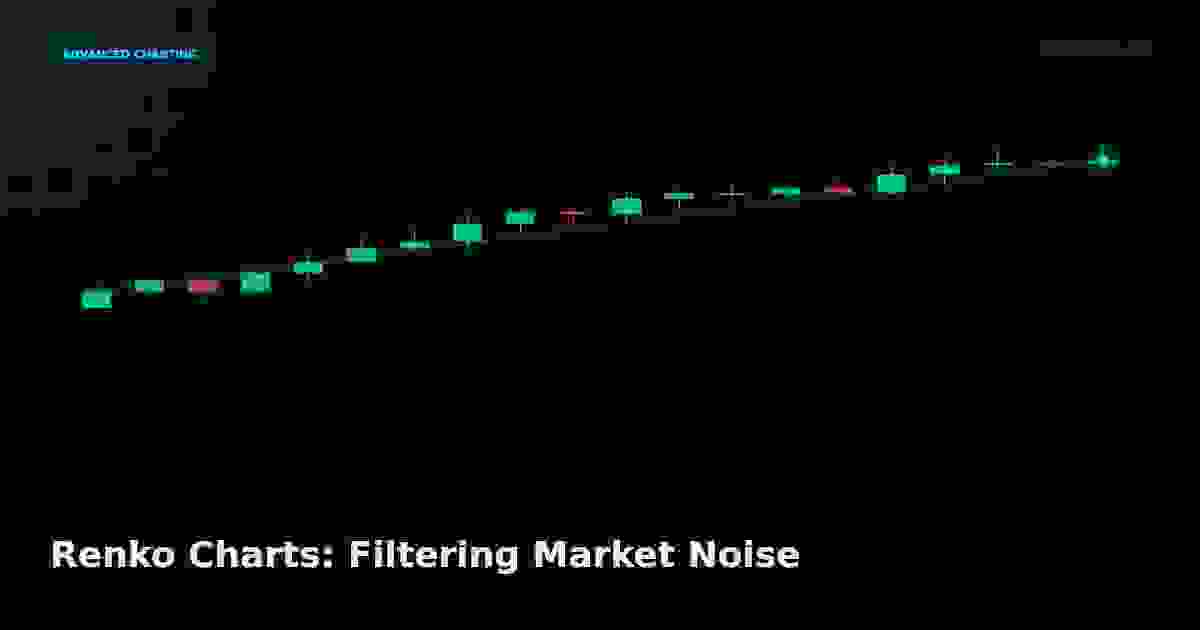
Renko charts strip time and small price moves out of the equation, leaving a clean trend picture built from bricks of fixed size.
Range Bars and Constant Range Bars
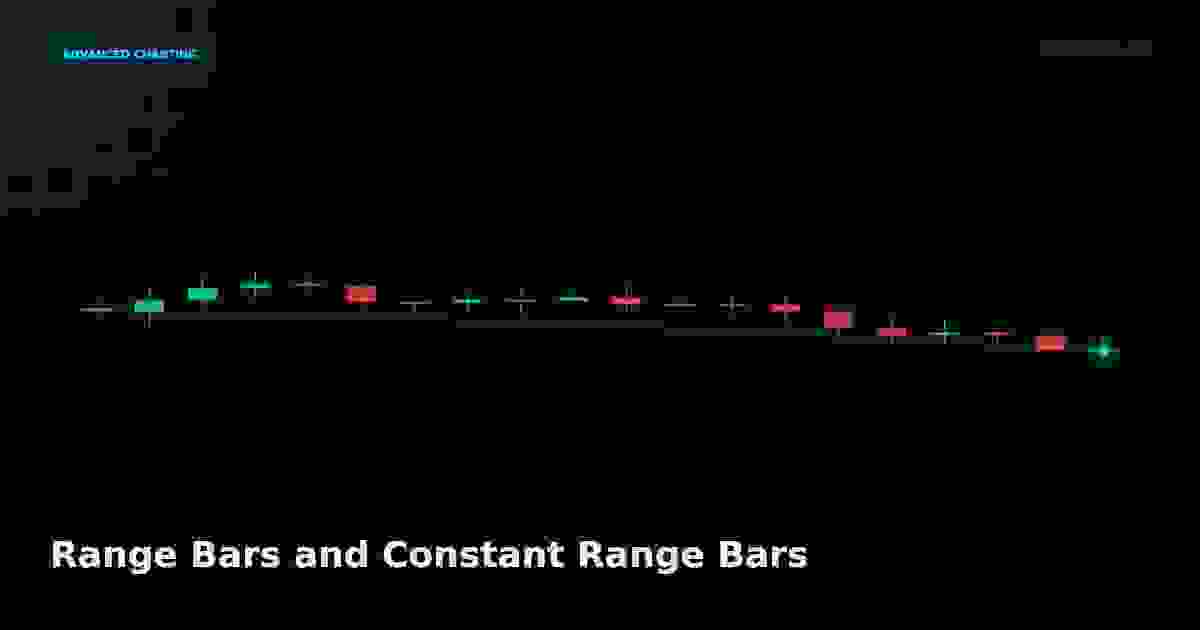
Range bars print a new candle only when price travels a fixed distance, removing time from the chart and giving scalpers clean volatility-based setups.
Point and Figure Charts: Price Targets
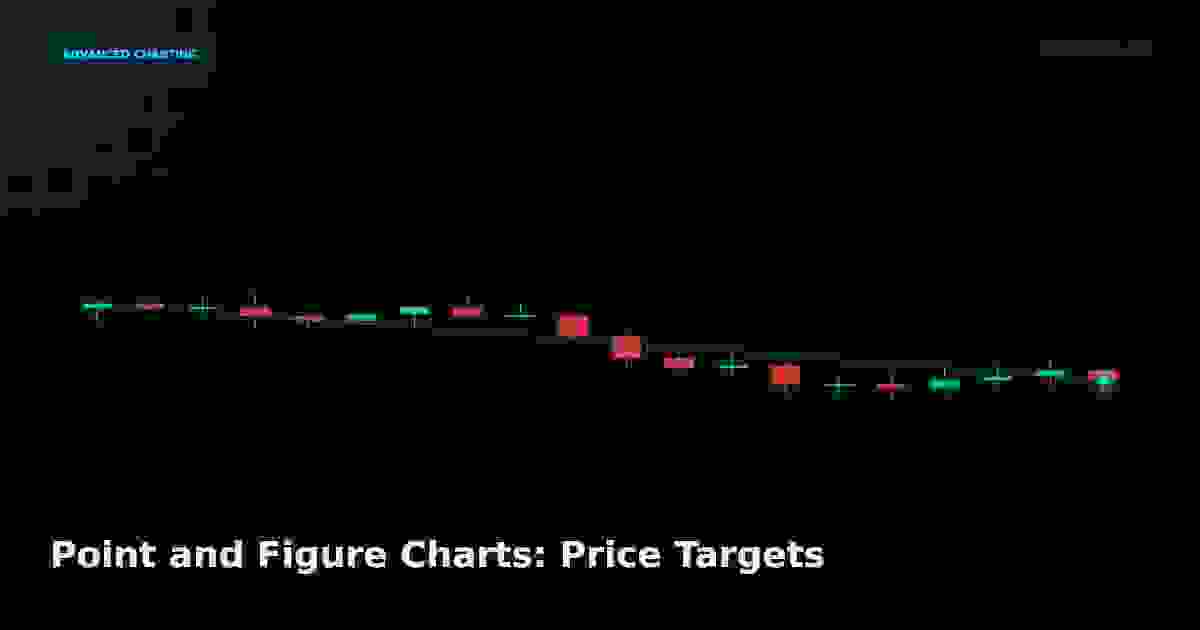
Point and Figure charts ignore time and volume, plotting only meaningful price moves to reveal clean trends, support, resistance, and measured targets.
Line Break and Market Structure
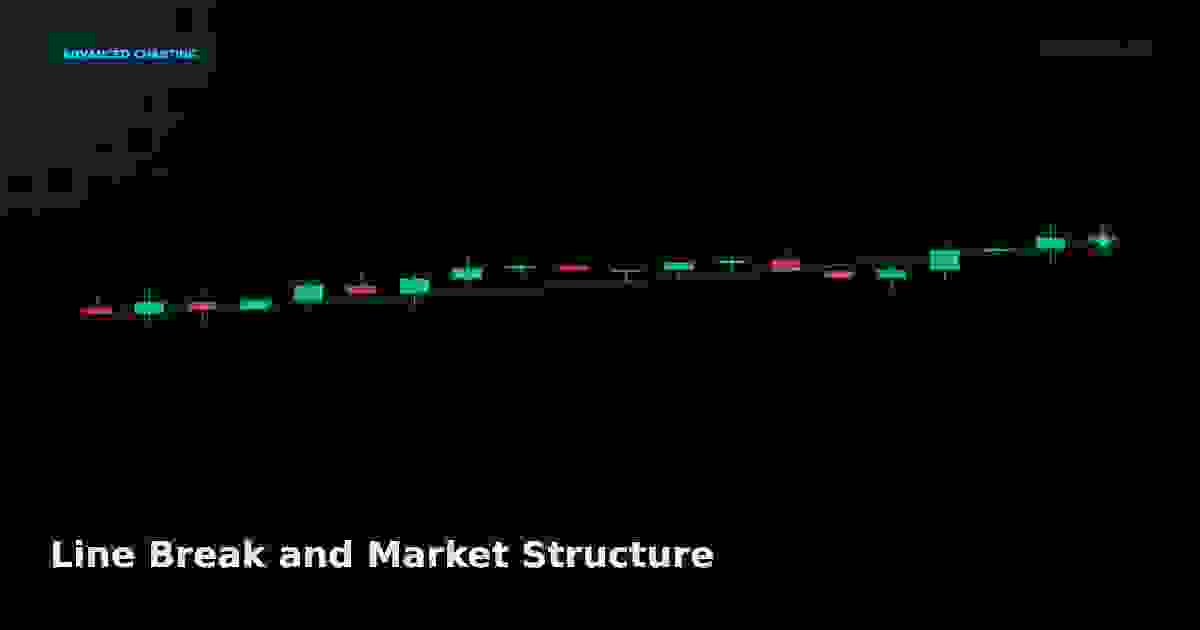
Line break methods expose market structure — the sequence of higher highs, lower lows, and break of structure points that define trend direction.