トレーディングブログ
体系的、深掘り、実践的。初心者向けに厳選。
#price-structure の記事を22件表示
#price-structure
Trend Strength Assessment: ADX, MA Slope, and Price Pace
Three independent measures of trend strength — ADX, moving average slope, and price pace — with strength-grade thresholds and position-sizing rules for each grade.
Top-Down Timeframe Alignment: The Top-Down Analysis Method
Top-down analysis aligns bias, level, and trigger across three timeframes; learn the stack ratios, alignment rule, common failures, and the discipline that creates the edge.
Ranging Market Edges: Trading the Boundaries
Markets range 70% of the time; learn range identification, edge-fade entries, breakout allocation, range failure signals, and time-of-day edge for the dominant regime.
Liquidity Sweep Patterns: Identifying Stop Runs
Liquidity sweeps — stop runs beyond obvious levels that reverse — are high-probability reversals; learn the four-component pattern, common setups, and entry mechanics with tight stops.
HH, HL, LL, LH Marking: Standardized Trend Rules
Standardized rules for marking higher highs, higher lows, lower lows, and lower highs — swing detection methods, major-swing filters, and multi-timeframe alignment.
Failed Market Structure Signals: Response and Damage Control
Market structure signals fail 35–45% of the time; learn the failure-as-signal principle, response protocol, early-warning signs, and the trap-and-reverse play that turns losses into wins.
BOS vs CHoCH: Practical Distinction in Live Trading
BOS confirms continuation; CHoCH warns of reversal — learn the directional-context rule, real-time identification sequence, and validation filters for live trading.
Tail Bar and Long Wick Trading Strategy
Long-wick candles — often called tail bars — reveal rejection at a price, and trading them as a strategy means understanding what the wick is telling you about who controls the market.
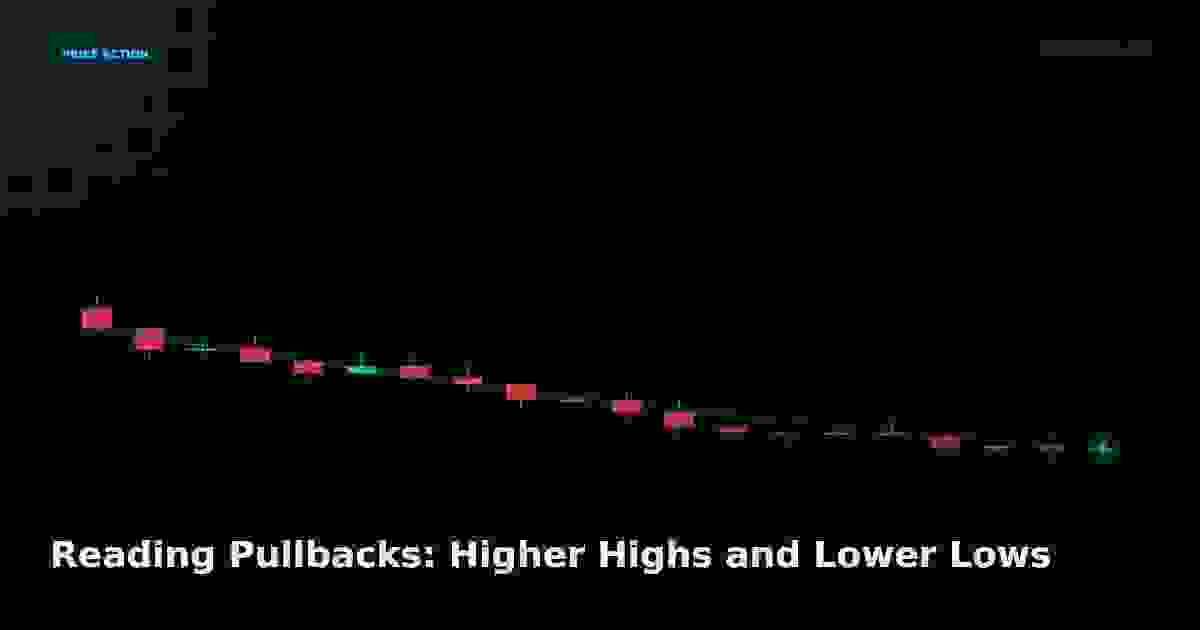
Reading Pullbacks: Higher Highs and Lower Lows
Pullbacks are where trends continue or die, and reading the structure of a pullback — whether it makes higher highs or breaks them — tells you whether to enter, wait, or reverse.
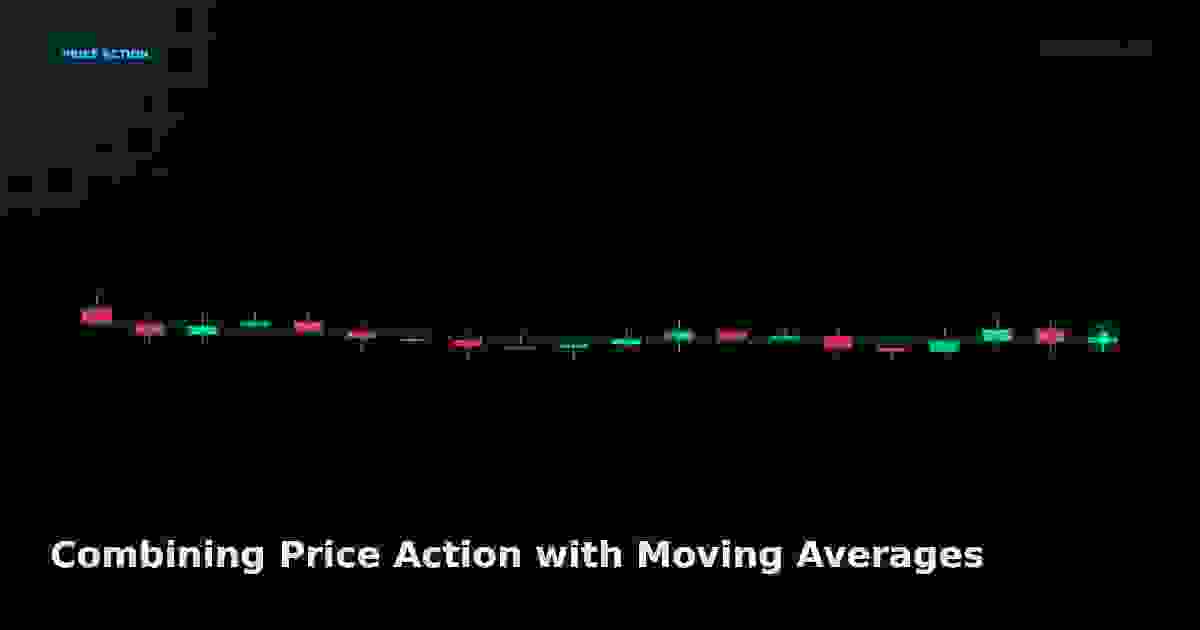
Combining Price Action with Moving Averages
Moving averages aren't a replacement for price action — they're a tool to filter it, and combining the two gives you trend context plus precise price-based entries.
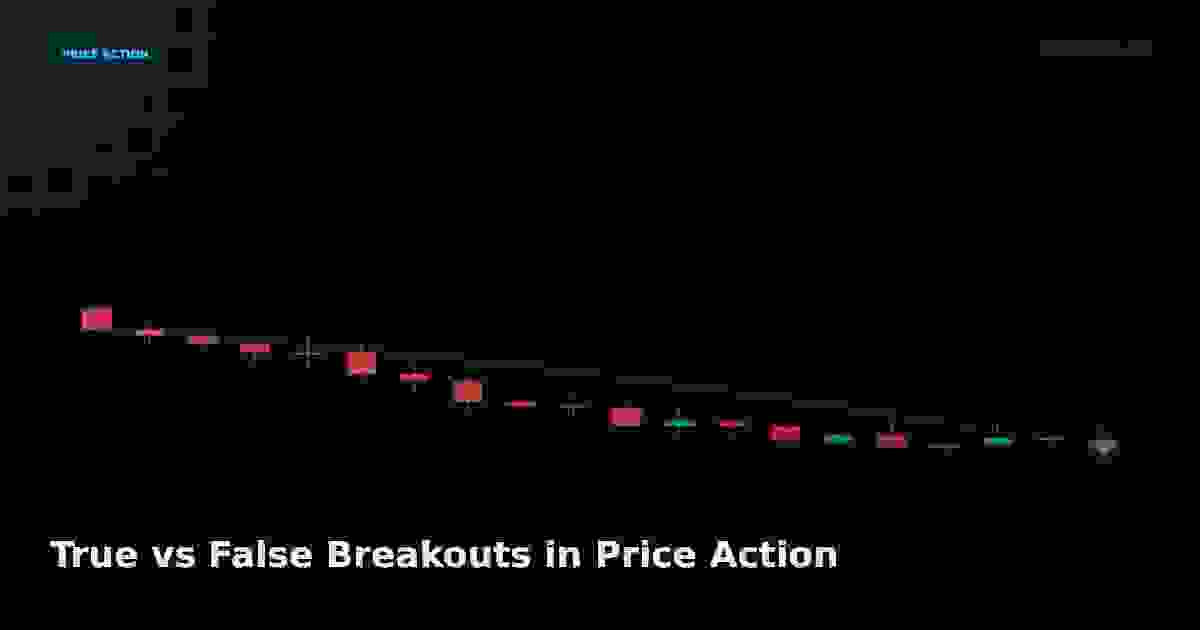
True vs False Breakouts in Price Action
Breakouts are where most beginners lose money, so learning to separate a true breakout from a false one using price action is one of the most profitable skills you can build.
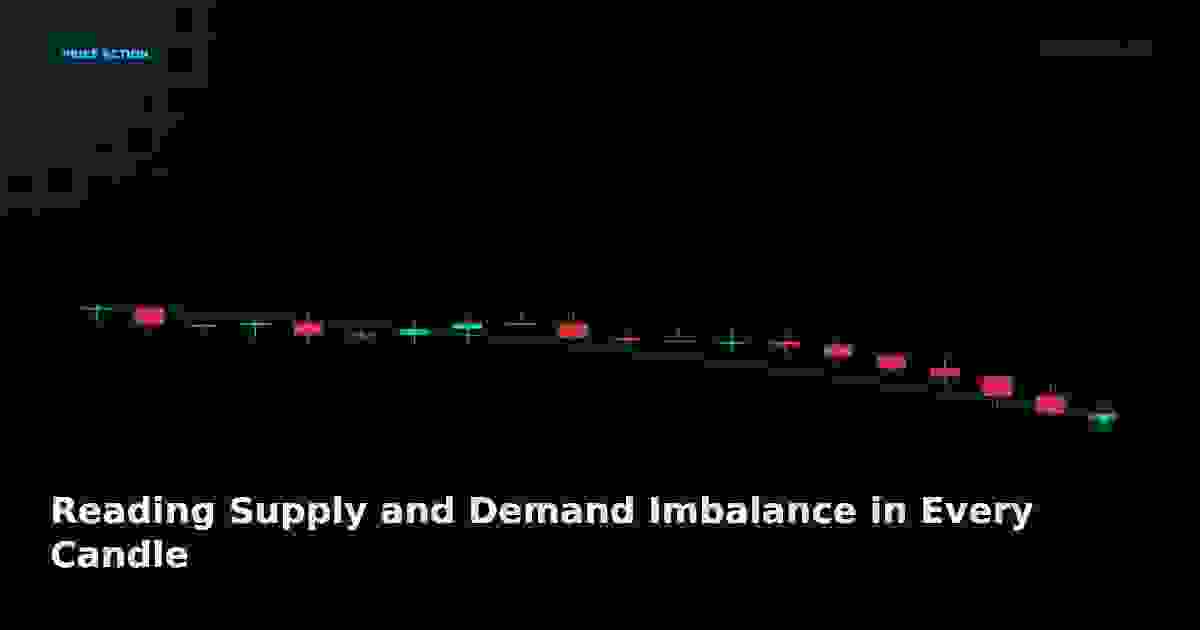
Reading Supply and Demand Imbalance in Every Candle
Every candle is a record of supply and demand imbalance, and learning to read which side controlled each candle gives you a real edge over traders who only look at patterns.